Business Intelligence in Fortune Maritime Solution

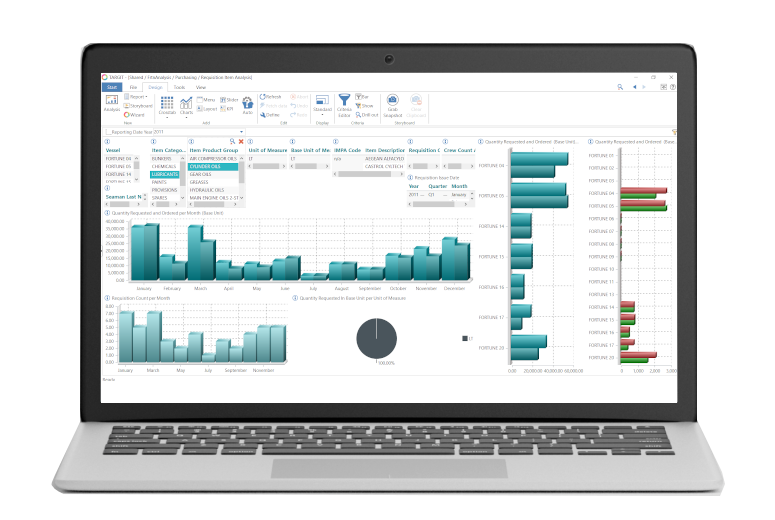
Microsoft Dynamics 365 Business Central collects data daily, covering potentially all departments of a maritime company. At some point the volume and type of data is such that it is hard for a human to get insight of the underlying information, identify problems and make decisions. This is where our business intelligence reporting comes into place: it groups and analyzes data in a graphical manner, conveying information instantly to the end user. The end user, either a user in a specific department of the maritime company, or a member of the management team can get up-to-date, accurate information organized in a manner that allows interaction and drill down.

PowerBI Analytics
Power BI Analytics

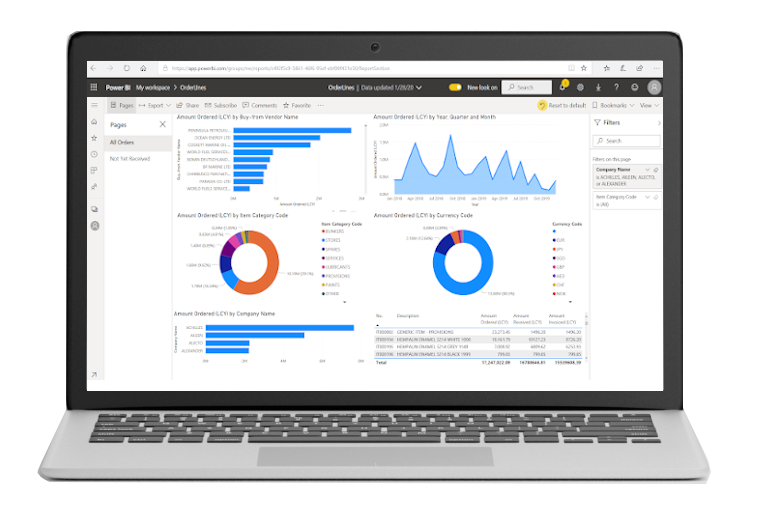
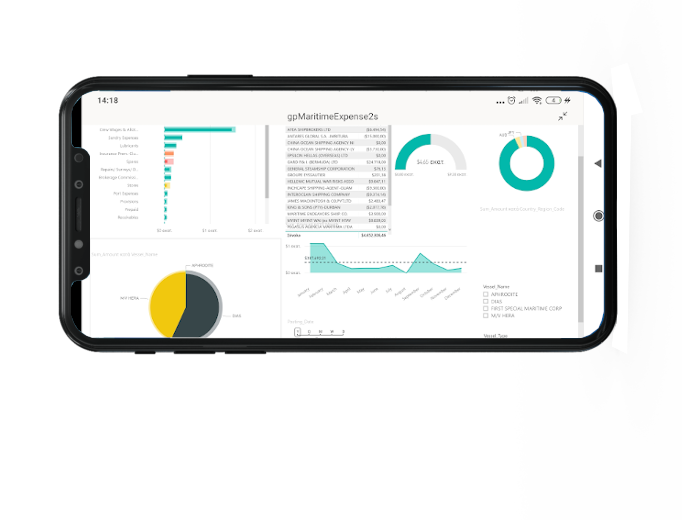
Microsoft Dynamics 365 Business Central gives the user the ability to turn pages into web services, so importing data into the analytics tool is easier than ever. Business Central and PowerBI are fully integrated and after a short time getting familiar with the analysis tools, users can create their own reports. Moreover, Key Performance Indicators (KPIs) can be embedded in this kind of reporting, together with automatic notifications to specific users or groups when a threshold is reached. The analysis views that are created are fully interactive. Users can drill down, apply filters (e.g., select vessels, fleets, time periods, and get the corresponding results instantly.
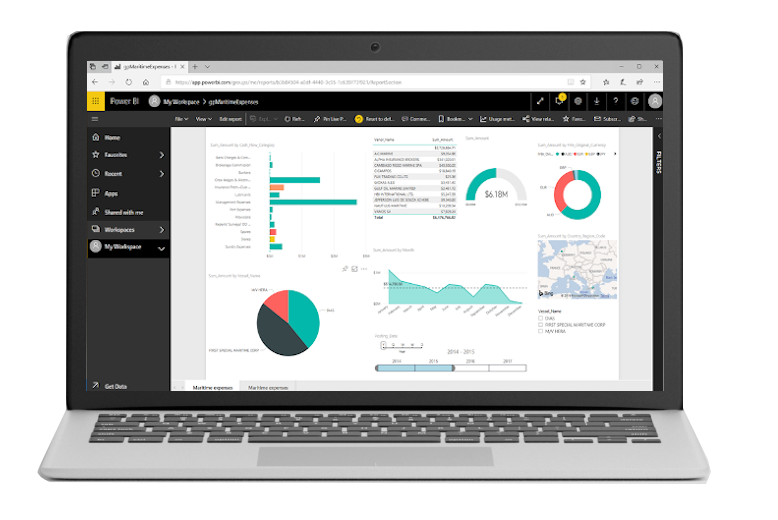
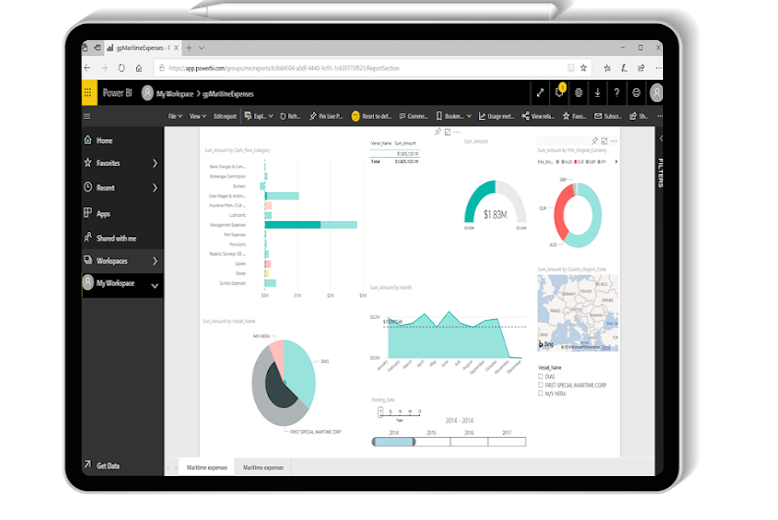
This approach provides significant benefits:

  • Report provide information that is easy to understand at a glance.

  • Reports contain reliable data coming directly from the system without human intervention.

  • Reports are accessible from anywhere and from any device.

  • Full interactive capabilities are provided.

  • System generates automatic notifications regarding KPIs.

  • End users can create their own reports in a graphical environment.

Power BI Analytics
PowerBI laptop screenshot
Power BI mobile app